
Install the Grafana Plug-In to Query Events in the Radiant Log Manager
Enable Grafana access to events stored in the Radiant Log Manager to create custom dashboards and visualizations.
In this guide, you will use the Grafana plug-in to query Radiant Security’s Log Management data from Grafana. This allows you to build custom dashboards, visualizations, and analytics for deeper insights into your logs.
Requirements
Note: The Grafana plug-in does not currently support Grafana Cloud.
Configure the data connector in Radiant Security
Log in to Radiant Security.
From the navigation menu, click Settings > Data Connectors and click + Add Connector.
Search for and select the Radiant Security Grafana Plug-In option from the list and then click Data Feeds.
Under Select your data feeds, select Grafana Security Ops - Raw Events and click Credentials.
Under Credential Name, give the credential an identifiable name (e.g.
Radiant-Security-Events).Under Required Credentials, in the Connector tag field enter a value. This value will act as the salt to randomize the unique Token you’ll download in the next step.
Click Add Connector.
Copy and save the connector Token value using the clipboard option or download the Token file. You will need this token to complete the configuration.
Click Done to save your changes.
Install the Grafana plug-in
Before you begin, ensure you have the following:
The zip file containing the Radiant Grafana plug-in. Contact a member from our support team to request the file.
Grafana installed on your local server or virtual machine.
Note: The plug-in is private and unsigned, so it requires some modifications in order to enable installation.
Locate your Grafana configuration file
Find the configuration file named
grafana.ini. The file location varies by operating system and installation method. Refer to Configure Grafana for more information.
Enable the unsigned plug-in
Open the
grafana.inifile and set the following to allow Radiant Security's unsigned plug-in to load:
Save and close the file.
Install the plug-in files
Extract the plug-in into the Grafana plug-ins directory.
The full directory path may differ depending on operating system and Grafana installation method. For installation on MacOS, the full path for a Homebrew installation is:
If your plug-ins directory is in a different location, adjust the path accordingly.
Apply the changes by restarting the Grafana service.
Optional: Verify the settings in Grafana
In Grafana, navigate to Administration > General > Settings.
paths > plugins points to the parent directory of
radiantsecurity-datasourcewhere the plug-in has been extracted.plugins > allow_loading_unsigned_plugins is set to
radiantsecurity-radiantsecurity-datasource.
Create and configure a data source
After installing the Grafana plug-in, connect Grafana to Radiant Security by creating a new data source with your API token and endpoint URL.
In Grafana, create a new data source with the plug-in by navigating to Administration > Plugins and data. Search for Radiant Security and the plug-in will appear.

Click Save & test. The plug-in is now available as a data source and can be seen in Connections > Data source.
Click the plug-in. You'll see a warning that the plugin is unsigned. This is expected as the Radiant plug-in is private and hasn't gone through Grafana's public plugin signing process. Click the Add new data sources button.
For Name, enter a name for the plug-in.
For API Key, enter the Token that you created and copied from the first step of this guide: Configure the data connector in Radiant Security.
For URL, set the appropriate endpoint for your region:
US region:
https://plugin.radiantsecurity.ai/grafana-plugins-proxy/qwEU region:
https://plugin.eu1.radiantsecurity.ai/grafana-plugins-proxy/qw.

Click Save & test.
Create a Grafana dashboard and visualization
Create a new dashboard in Grafana to display a log volume histogram for all connectors.
In the main menu in Grafana, click Dashboards.
On the Dashboards page, click New and select New Dashboard from the drop-down menu.
Click + Add visualization.
Select the data source that was just created with the plug-in.
The visualization will default to a Time series from the top right pull-down menu.
To test the visualization, enter a wildcard query
*in the Lucene Query field. This should populate the graph with aggregated data representing all received logs over the last six hours. If needed, you can adjust the time range accordingly.Add a Group By field by clicking the + at the end of the Group By row.
Select rs_connectorType to be the first Group By criteria. Click Refresh to see the new set of data which should include disaggregated log types.
In the right panel, configure the legend and title by applying the following modifications:
Title: Connectors with Log Volume
Legend Mode: Table
Legend Placement: Right
Legend Values: Total
Axis Scale: Logarithmic (assuming multiple log sources with a wide range of volume)
Log Base: 10
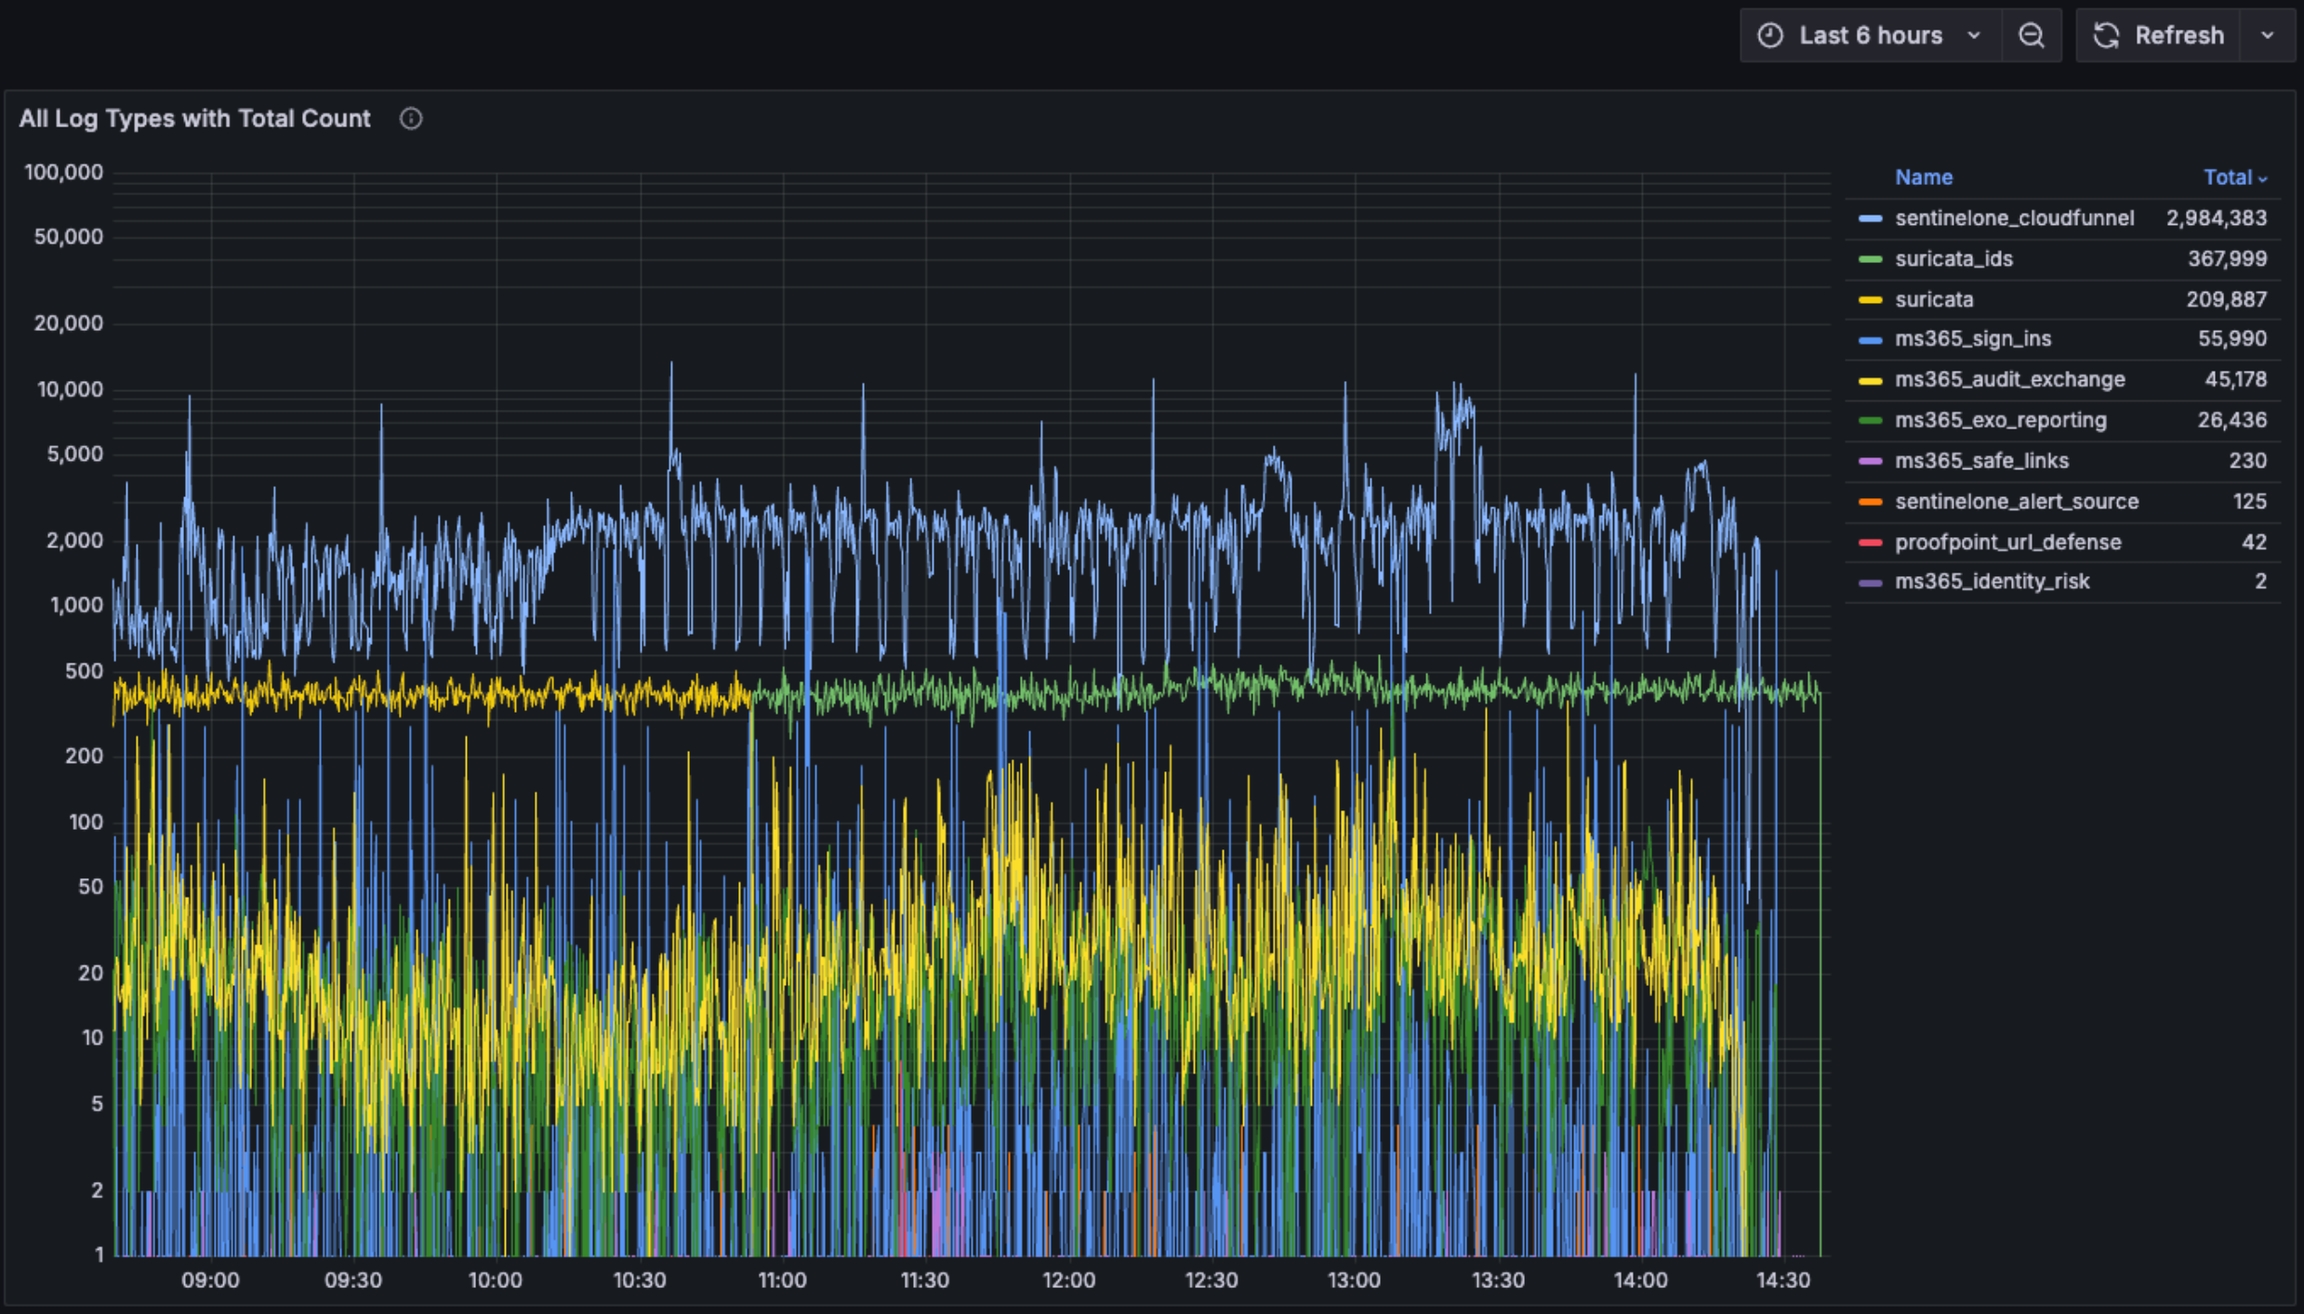
Click Save Dashboard to save the changes and exit to the dashboard view. The new dashboard should look similar to the image below.
Last updated
Was this helpful?