> For the complete documentation index, see [llms.txt](https://help.radiantsecurity.ai/llms.txt). Markdown versions of documentation pages are available by appending `.md` to page URLs; this page is available as [Markdown](https://help.radiantsecurity.ai/log-management/grafana-plug-in/install-the-grafana-plug-in-to-query-events-in-the-radiant-log-manager.md).
# Install the Grafana Plug-In to Query Events in the Radiant Log Manager
In this guide, you will use the Grafana plug-in to query Radiant Security’s Log Management data from Grafana. This allows you to build custom dashboards, visualizations, and analytics for deeper insights into your logs.
### **Requirements**
* [ ] A Grafana instance installed in your local or virtual environment.
* [ ] The Radiant Security Grafana plugin zip file provided to you upon request.
{% hint style="info" %}
**Note**: The Grafana plug-in does not currently support Grafana Cloud.
{% endhint %}
### Configure the data connector in Radiant Security
1. Log in to [Radiant Security](https://app.radiantsecurity.ai/).
2. From the navigation menu, click **Settings** > **Data Connectors** and click **+ Add Connector**.
3. Search for and select the **Radiant Security Grafana Plug-In** option from the list and then click **Data** **Feeds**.
4. Under **Select your data feeds**, select **Grafana Security Ops - Raw Events** and click **Credentials**.
5. Under **Credential** **Name**, give the credential an identifiable name (e.g. `Radiant-Security-Events`).
6. Under **Required** **Credentials**, in the **Connector** **tag** field enter a value. This value will act as the salt to randomize the unique **Token** you’ll download in the next step.
7. Click **Add Connector**.
8. Copy and save the connector **Token** value using the clipboard option or download the **Token** file. You will need this token to complete the configuration.
9. Click **Done** to save your changes.
### Install the Grafana plug-in
Before you begin, ensure you have the following:
* The zip file containing the Radiant Grafana plug-in. Contact a member from our support team to request the file.
* Grafana installed on your local server or virtual machine.
{% hint style="info" %}
**Note:** The plug-in is private and unsigned, so it requires some modifications in order to enable installation.
{% endhint %}
#### Locate your Grafana configuration file
1. Find the configuration file named `grafana.ini`. The file location varies by operating system and installation method. Refer to [Configure Grafana](https://grafana.com/docs/grafana/latest/setup-grafana/configure-grafana/) for more information.
#### Enable the unsigned plug-in
1. Open the `grafana.ini` file and set the following to allow Radiant Security's unsigned plug-in to load:
```ini
allow_loading_unsigned_plugins = radiantsecurity-radiantsecurity-datasource
```
Save and close the file.
#### Install the plug-in files
1. Extract the plug-in into the Grafana plug-ins directory.
```
var/lib/grafana/plugins/radiantsecurity-datasource
```
The full directory path may differ depending on operating system and Grafana installation method. \
For installation on MacOS, the full path for a Homebrew installation is:
```ini
/opt/homebrew/var/lib/grafana/plugins/radiantsecurity-datasource
```
If your plug-ins directory is in a different location, adjust the path accordingly.
2. Apply the changes by restarting the Grafana service.
#### Optional: Verify the settings in Grafana
1. In Grafana, navigate to **Administration** **> General > Settings**.
2. **paths >** **plugins** points to the parent directory of `radiantsecurity-datasource` where the plug-in has been extracted.
3. **plugins** **> allow\_loading\_unsigned\_plugins** is set to `radiantsecurity-radiantsecurity-datasource`.
### Create and configure a data source
After installing the Grafana plug-in, connect Grafana to Radiant Security by creating a new data source with your API token and endpoint URL.
1. In Grafana, create a new data source with the plug-in by navigating to **Administration** > **Plugins** **and data**. Search for **Radiant Security** and the plug-in will appear.
2. Click **Save & test**. The plug-in is now available as a data source and can be seen in **Connections > Data source.**
3. Click the plug-in. You'll see a warning that the plugin is unsigned. This is expected as the Radiant plug-in is private and hasn't gone through Grafana's public plugin signing process. Click the **Add new data sources** button.
4. For **Name**, enter a name for the plug-in.
5. For **API Key**, enter the **Token** that you created and copied from the first step of this guide: [**Configure the data connector in Radiant Security**](#configure-the-data-connector-in-radiant-security)**.**
6. For **URL**, set the appropriate endpoint for your region:
* US region: `https://plugin.radiantsecurity.ai/grafana-plugins-proxy/qw`
* EU region: `https://plugin.eu1.radiantsecurity.ai/grafana-plugins-proxy/qw` .
7. For **Storage Location**, if you have [Bring Your Own Bucket (BYOB)](/log-management/bring-your-own-bucket-byob.md) storage enabled, make sure to enable the toggle before saving your settings. This setting must match your storage configuration for the data source to connect successfully
6. Click **Save & test**.
### Create a Grafana dashboard and visualization
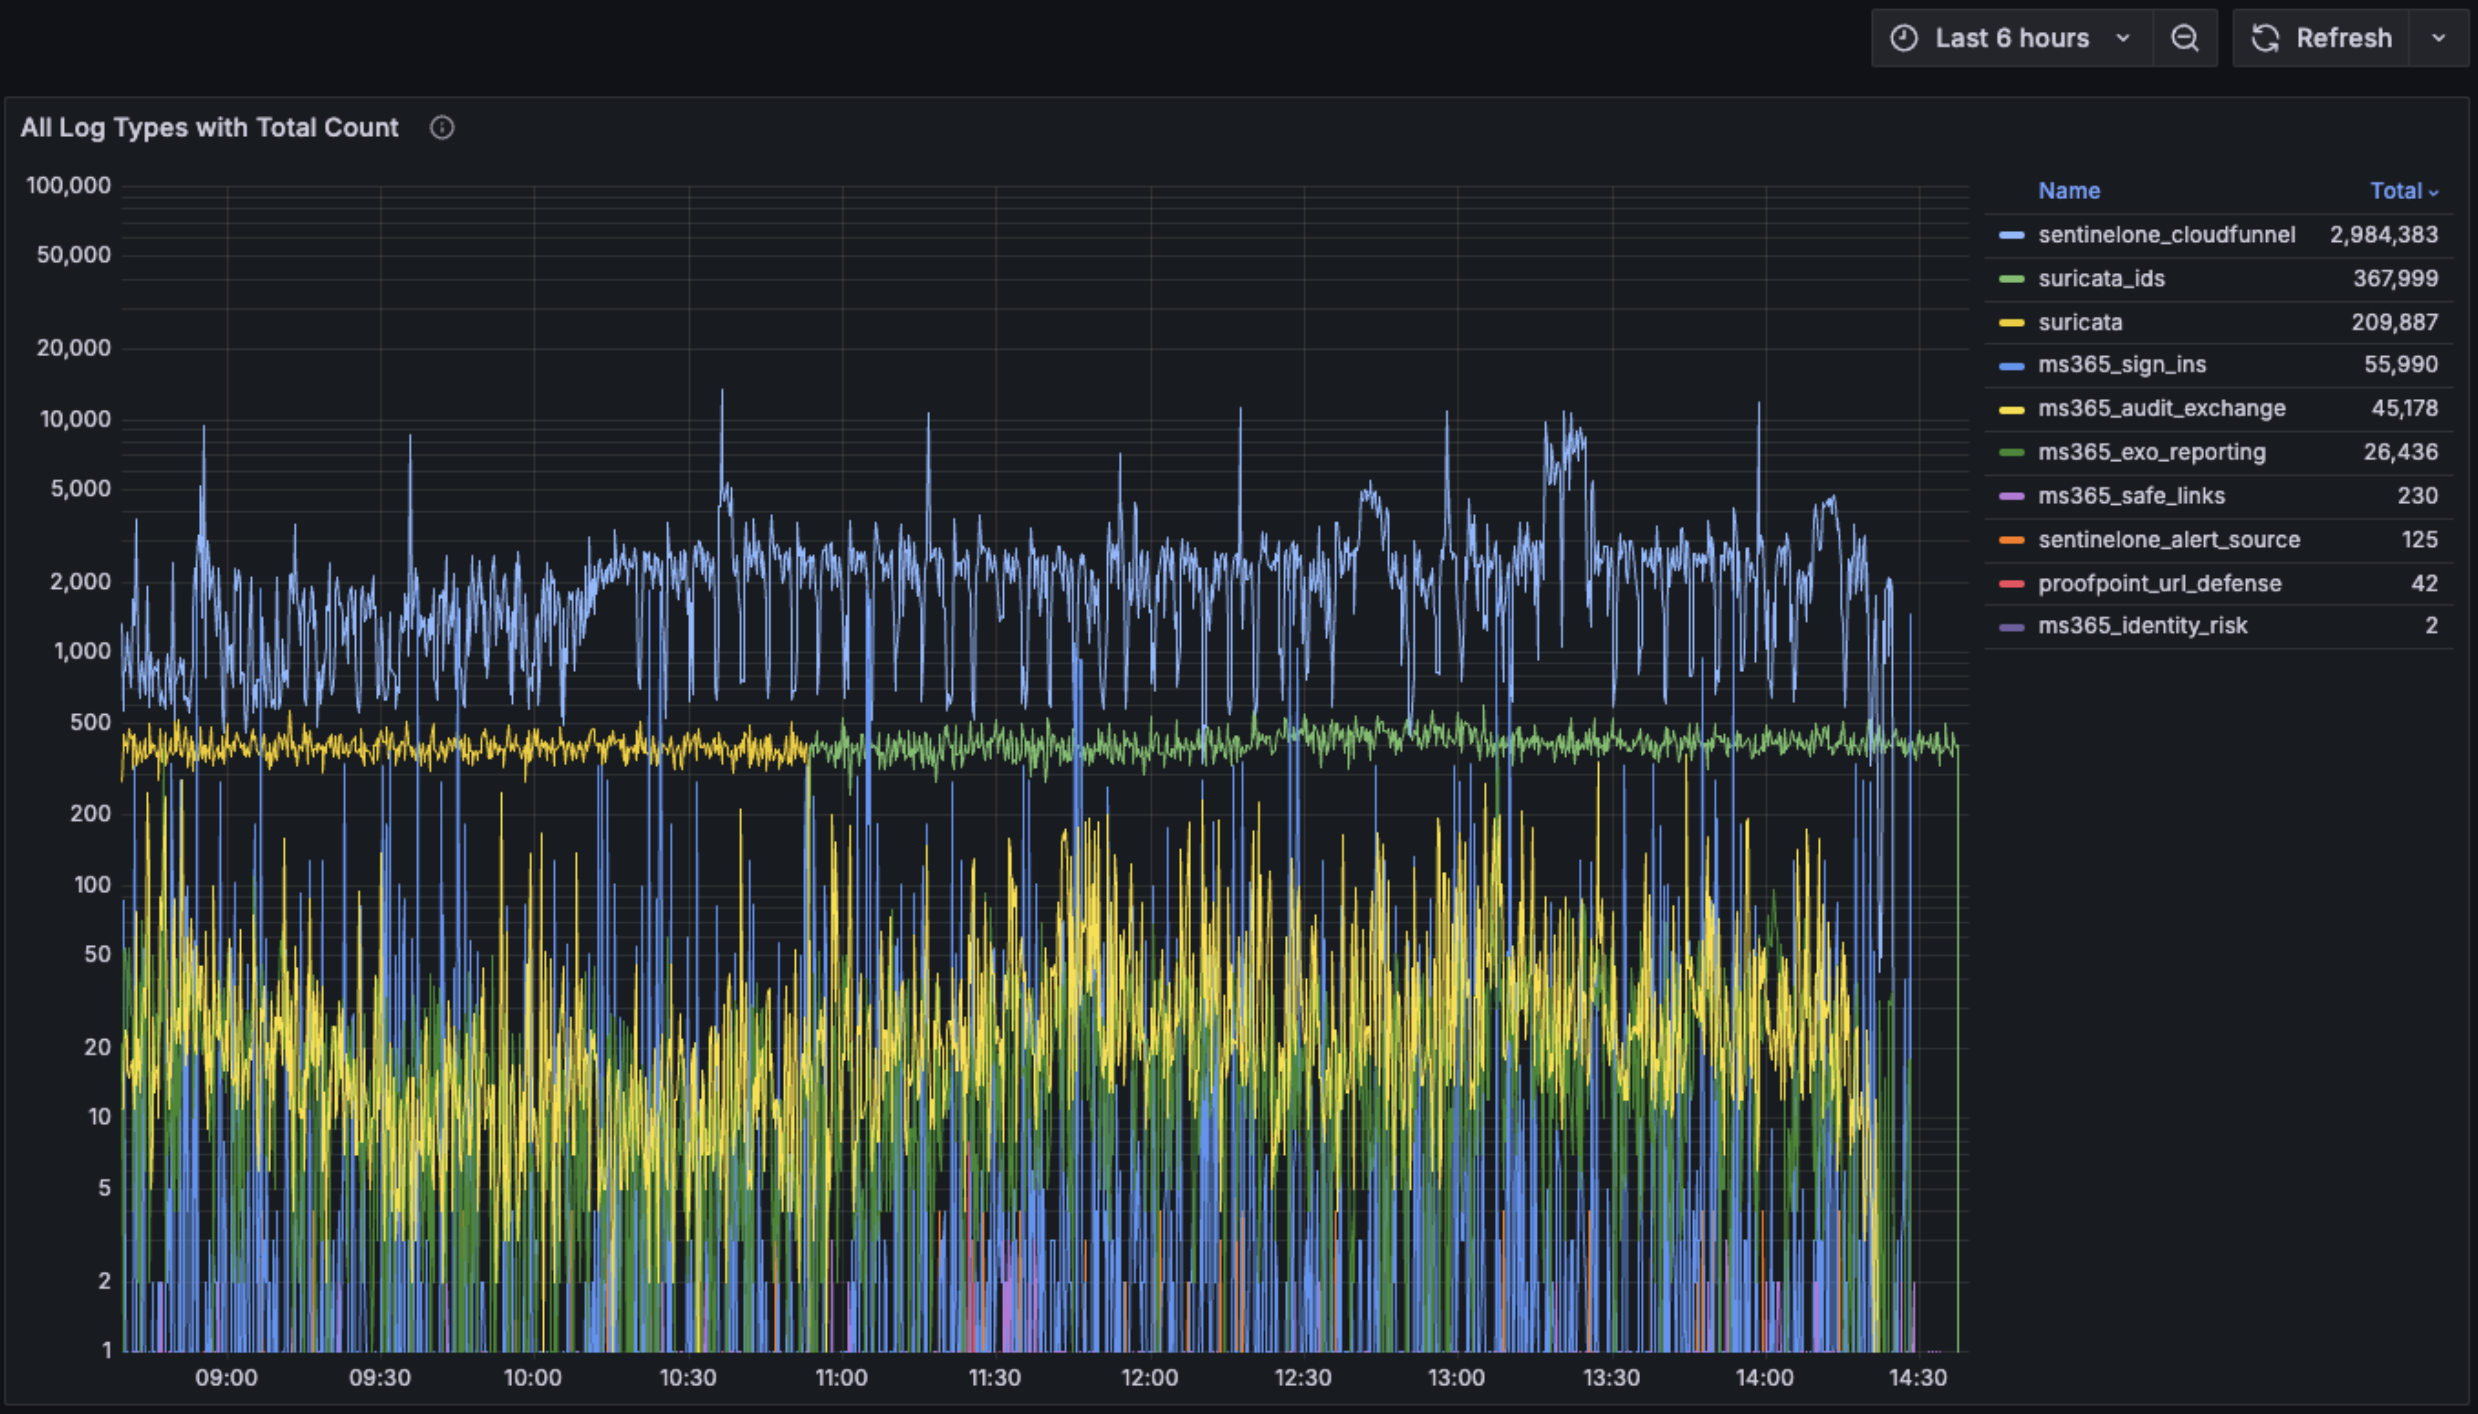
Create a new dashboard in Grafana to display a log volume histogram for all connectors.
1. In the main menu in Grafana, click **Dashboards.**
2. On the **Dashboards** page, click **New** and select **New Dashboard** from the drop-down menu.
3. Click **+ Add visualization**.
4. Select the data source that was just created with the plug-in.
5. The visualization will default to a **Time series** from the top right pull-down menu.
6. To test the visualization, enter a wildcard query `*` in the **Lucene Query** field. This should populate the graph with aggregated data representing all received logs over the last six hours. If needed, you can adjust the time range accordingly.
7. Add a **Group By** field by clicking the **+** at the end of the **Group By** row.
8. Select **rs\_connectorType** to be the first **Group By** criteria. Click **Refresh** to see the new set of data which should include disaggregated log types.
9. In the right panel, configure the legend and title by applying the following modifications:
1. **Title**: Connectors with Log Volume
2. **Legend Mode**: Table
3. **Legend Placement**: Right
4. **Legend Values**: Total
5. **Axis Scale**: Logarithmic (assuming multiple log sources with a wide range of volume)
6. **Log Base**: 10
10. Click **Save Dashboard** to save the changes and exit to the dashboard view. The new dashboard should look similar to the image below.
---
# Agent Instructions
This documentation is published with GitBook. GitBook is the documentation platform designed so that both humans and AI agents can read, navigate, and reason over technical content effectively. Learn more at gitbook.com.
## Querying This Documentation
If you need additional information that is not directly available in this page, you can query the documentation dynamically by asking a question.
Perform an HTTP GET request on the current page URL with the `ask` query parameter, and the optional `goal` query parameter:
```
GET https://help.radiantsecurity.ai/log-management/grafana-plug-in/install-the-grafana-plug-in-to-query-events-in-the-radiant-log-manager.md?ask=&goal=
```
`ask` is the immediate question: it should be specific, self-contained, and written in natural language.
`goal` is optional and describes the broader end goal you are ultimately trying to accomplish on behalf of the user. GitBook uses it to tailor the answer towards what is most useful for that goal.
The response will contain a direct answer to the question and relevant excerpts and sources from the documentation.
Use this mechanism when the answer is not explicitly present in the current page, you need clarification or additional context, or you want to retrieve related documentation sections.